How calculate percentages not in canned reports


I need to calculate giving percentages for different groups, such as Current Parents and the Board. My organization isn't satisfied with the standard report, so we've done it manually for some time. However, we're looking for a more reliable method. Could anyone share their approach?
Comments
-
- Get data
- manual export from database view
- automate SKY API data collection (my method)
- nightly backup from Blackbaud
- create custom report via reporting tool
- Excel report building
- Power BI (my method)
- Tableau
0 - Get data
-
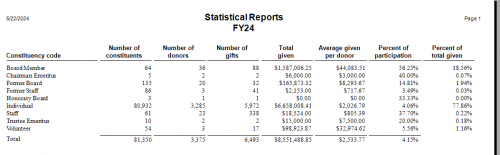
@Ombretta di Massa Any reason your organization does not like the report located in Demographics and Statiscal Reports/ Statistical Reports. I find this report useful and accurate.
 2
2 -
@Ombretta di Massa, I use the same report as @Joe Moretti, but I also acknowledge that sometimes a person needs more depth or better filters than the canned reports offer. For example, when analyzing an A/B mailing, it's a big time investment for me to crunch the response rates of our constituencies because we need to weigh secondary conditional factors, such as
- Did alumni who are also monthly donors have better engagement than other alumni (multiple constituencies affecting response, since RE only considers a single hierarchical order)
- Do recent grade respond differently than seasoned alumni
- Do regional donors respond differently or in other mediums than national donors
- Did those with multi-channel communications respond at a higher rate than single-channel recipients
- What percentage of donors upgraded vs maintained or downgraded
…to name just a few considerations.
If your report is too complex for the canned reports, even with some data restructuring in your consituencies, and if it is in a stable format that you run frequently, then I would suggest @Alex Wong's method (which I have never tried). His method basically replaces the custom Crystal Reports we used to be able to operate in database view. Otherwise, if your reporting needs change each time depending on your current year's strategic targets, then like me you are probably stuck with exporting everything into excel and crunching it there.
0 -
@Alex Wong I just saw your message and I am so sorry about it! I don't receive any alerts when someone writes back to me. My deepest apologies, and thank you for your help!?
0 -
@Faith Murray, I just saw your message, and as I said to Alex Wong, I am deeply sorry for the lack of response due to the fact that I don't get any alert when I get a message. My apologies!
0 -
@Alex Wong, could you share a report created with Power BI and Tableau? I don't use any of them, and I'd like to see what they look like.
0 -
@Joe Moretti, my apologies for replying this late. I just saw the message! I don't get any alerts when someone writes to me. Regarding the canned report, this is what I usually use, but this school prefers other methods.
0 -
@Ombretta di Massa
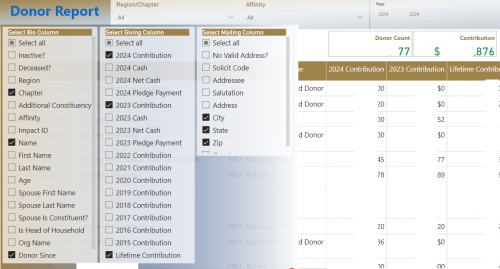
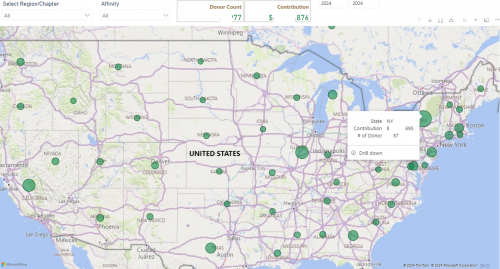
Power BI can do a lot of various display of data: bar chart, line chart, pie chart, table of information, filtering on various data point directly on the report, displaying data on mapped location, etc.
 0
0


Categories
- All Categories
- Shannon parent
- shannon 2
- shannon 1
- 21 Advocacy DC Users Group
- 14 BBCRM PAG Discussions
- 89 High Education Program Advisory Group (HE PAG)
- 28 Luminate CRM DC Users Group
- 8 DC Luminate CRM Users Group
- Luminate PAG
- 5.9K Blackbaud Altru®
- 58 Blackbaud Award Management™ and Blackbaud Stewardship Management™
- 409 bbcon®
- 2K Blackbaud CRM™ and Blackbaud Internet Solutions™
- donorCentrics®
- 1.1K Blackbaud eTapestry®
- 2.8K Blackbaud Financial Edge NXT®
- 1.1K Blackbaud Grantmaking™
- 527 Education Management Solutions for Higher Education
- 21 Blackbaud Impact Edge™
- 1 JustGiving® from Blackbaud®
- 4.6K Education Management Solutions for K-12 Schools
- Blackbaud Luminate Online & Blackbaud TeamRaiser
- 16.4K Blackbaud Raiser's Edge NXT®
- 4.1K SKY Developer
- 547 ResearchPoint™
- 151 Blackbaud Tuition Management™
- 1 YourCause® from Blackbaud®
- 61 everydayhero
- 3 Campaign Ideas
- 58 General Discussion
- 115 Blackbaud ID
- 87 K-12 Blackbaud ID
- 6 Admin Console
- 949 Organizational Best Practices
- 353 The Tap (Just for Fun)
- 235 Blackbaud Community Feedback Forum
- 124 Ninja Secret Society
- 32 Blackbaud Raiser's Edge NXT® Receipting EAP
- 55 Admissions Event Management EAP
- 18 MobilePay Terminal + BBID Canada EAP
- 36 EAP for New Email Campaigns Experience in Blackbaud Luminate Online®
- 109 EAP for 360 Student Profile in Blackbaud Student Information System
- 41 EAP for Assessment Builder in Blackbaud Learning Management System™
- 9 Technical Preview for SKY API for Blackbaud CRM™ and Blackbaud Altru®
- 55 Community Advisory Group
- 46 Blackbaud Community Ideas
- 26 Blackbaud Community Challenges
- 7 Security Testing Forum
- 1.1K ARCHIVED FORUMS | Inactive and/or Completed EAPs
- 3 Blackbaud Staff Discussions
- 7.7K ARCHIVED FORUM CATEGORY [ID 304]
- 1 Blackbaud Partners Discussions
- 1 Blackbaud Giving Search™
- 35 EAP Student Assignment Details and Assignment Center
- 39 EAP Core - Roles and Tasks
- 59 Blackbaud Community All-Stars Discussions
- 20 Blackbaud Raiser's Edge NXT® Online Giving EAP
- Diocesan Blackbaud Raiser’s Edge NXT® User’s Group
- 2 Blackbaud Consultant’s Community
- 43 End of Term Grade Entry EAP
- 92 EAP for Query in Blackbaud Raiser's Edge NXT®
- 38 Standard Reports for Blackbaud Raiser's Edge NXT® EAP
- 12 Payments Assistant for Blackbaud Financial Edge NXT® EAP
- 6 Ask an All Star (Austen Brown)
- 8 Ask an All-Star Alex Wong (Blackbaud Raiser's Edge NXT®)
- 1 Ask an All-Star Alex Wong (Blackbaud Financial Edge NXT®)
- 6 Ask an All-Star (Christine Robertson)
- 21 Ask an Expert (Anthony Gallo)
- Blackbaud Francophone Group
- 22 Ask an Expert (David Springer)
- 4 Raiser's Edge NXT PowerUp Challenge #1 (Query)
- 6 Ask an All-Star Sunshine Reinken Watson and Carlene Johnson
- 4 Raiser's Edge NXT PowerUp Challenge: Events
- 14 Ask an All-Star (Elizabeth Johnson)
- 7 Ask an Expert (Stephen Churchill)
- 2025 ARCHIVED FORUM POSTS
- 322 ARCHIVED | Financial Edge® Tips and Tricks
- 164 ARCHIVED | Raiser's Edge® Blog
- 300 ARCHIVED | Raiser's Edge® Blog
- 441 ARCHIVED | Blackbaud Altru® Tips and Tricks
- 66 ARCHIVED | Blackbaud NetCommunity™ Blog
- 211 ARCHIVED | Blackbaud Target Analytics® Tips and Tricks
- 47 Blackbaud CRM Higher Ed Product Advisory Group (HE PAG)
- Luminate CRM DC Users Group
- 225 ARCHIVED | Blackbaud eTapestry® Tips and Tricks
- 1 Blackbaud eTapestry® Know How Blog
- 19 Blackbaud CRM Product Advisory Group (BBCRM PAG)
- 1 Blackbaud K-12 Education Solutions™ Blog
- 280 ARCHIVED | Mixed Community Announcements
- 3 ARCHIVED | Blackbaud Corporations™ & Blackbaud Foundations™ Hosting Status
- 1 npEngage
- 24 ARCHIVED | K-12 Announcements
- 15 ARCHIVED | FIMS Host*Net Hosting Status
- 23 ARCHIVED | Blackbaud Outcomes & Online Applications (IGAM) Hosting Status
- 22 ARCHIVED | Blackbaud DonorCentral Hosting Status
- 14 ARCHIVED | Blackbaud Grantmaking™ UK Hosting Status
- 117 ARCHIVED | Blackbaud CRM™ and Blackbaud Internet Solutions™ Announcements
- 50 Blackbaud NetCommunity™ Blog
- 169 ARCHIVED | Blackbaud Grantmaking™ Tips and Tricks
- Advocacy DC Users Group
- 718 Community News
- Blackbaud Altru® Hosting Status
- 104 ARCHIVED | Member Spotlight
- 145 ARCHIVED | Hosting Blog
- 149 JustGiving® from Blackbaud® Blog
- 97 ARCHIVED | bbcon® Blogs
- 19 ARCHIVED | Blackbaud Luminate CRM™ Announcements
- 161 Luminate Advocacy News
- 187 Organizational Best Practices Blog
- 67 everydayhero Blog
- 52 Blackbaud SKY® Reporting Announcements
- 17 ARCHIVED | Blackbaud SKY® Reporting for K-12 Announcements
- 3 Luminate Online Product Advisory Group (LO PAG)
- 81 ARCHIVED | JustGiving® from Blackbaud® Tips and Tricks
- 1 ARCHIVED | K-12 Conference Blog
- Blackbaud Church Management™ Announcements
- ARCHIVED | Blackbaud Award Management™ and Blackbaud Stewardship Management™ Announcements
- 1 Blackbaud Peer-to-Peer Fundraising™, Powered by JustGiving® Blogs
- 39 Tips, Tricks, and Timesavers!
- 56 Blackbaud Church Management™ Resources
- 154 Blackbaud Church Management™ Announcements
- 1 ARCHIVED | Blackbaud Church Management™ Tips and Tricks
- 11 ARCHIVED | Blackbaud Higher Education Solutions™ Announcements
- 7 ARCHIVED | Blackbaud Guided Fundraising™ Blog
- 2 Blackbaud Fundraiser Performance Management™ Blog
- 9 Foundations Events and Content
- 14 ARCHIVED | Blog Posts
- 2 ARCHIVED | Blackbaud FIMS™ Announcement and Tips
- 59 Blackbaud Partner Announcements
- 10 ARCHIVED | Blackbaud Impact Edge™ EAP Blogs
- 1 Community Help Blogs
- Diocesan Blackbaud Raiser’s Edge NXT® Users' Group
- Blackbaud Consultant’s Community
- Blackbaud Francophone Group
- 1 BLOG ARCHIVE CATEGORY
- Blackbaud Community™ Discussions
- 8.3K Blackbaud Luminate Online® & Blackbaud TeamRaiser® Discussions
- 5.7K Jobs Board