Limited Release Access to New Report Builder - Create a custom Insight Bank


I was fortunate to be able to be part of the Limited Release wave of the new SKY Report Builder with Dashboards and Insights. There are prebuilt insights for your more common reporting needs, but would like to create a community collection for those who have the new Insight builder and create your own Insights.
Right now I am looking how to create a percent to goal Insight for a dashboard. I attached a sample but it is basically just blocks of data and nothing fancy with graph options.
Outside of what I am looking for would love to know about what other Insights you have built.
THanks!
Christine

Comments
-
Great idea! Will contribute once we 'get on the wave'

0 -
Just taking my first deep dive into the NXT Analysis Report Builder today. Having used Excel and Tableau for analysis for the last few years, I am struggling with this module and so far, it seems like it has many limitations around the pieces of data you can look at (much like Reports in "classic" RE). Is there a feedback or working group for early adopters or people on the 90 day trial?
Thanks,
Lori Robbins
Institute for Advanced Study
Princeton, New Jersey0 -
I agree Lori. There do seem to be some limitations (yes - why Reports in RE don't get used very much in my office) and it doesn't seem very intuitive to use. I'd like to get more information and hear how others are using it. Maybe I'm missing something.1
-
Thanks for the great feedback, everyone!
If there are specific data points you're looking to analyze but can't do so with an out-of-the-box insight for Dashboard builder or easily with Insight Designer (like Christine's "percent toward goals"), please share and brainstorm them here! Also, be sure to submit them to the Idea Bank so we can help gauge interest. This includes analogues to reports you may currently run in the database view, or — to Lori and Karen's point — ones you find difficult to pull off in either the web or database view of Raiser's Edge NXT.
Also, as Christine suggests, I'm eager to see what insights you create with Insight Designer. If you share them here, I'll look to contribute them to our collection of insight recipes for everyone to enjoy. Thanks!1 -
I'd like to report on "moves" from one prospect status to another. Currently, we can see the history of moves on individual records in webview of NXT, but there is no report capable of reflecting this information among all constituents. It would be nice to to see how many constituents have moved from "cultivation" to "ready to solicit" in the last month, for example. Even better, being able to see what the pipeline looks like now vs. a month ago on a time line graph would be highly useful.4
-
I have to add that as we're working through this feature there are so many things that we love about it. I'm having a little trouble getting the right numbers for total giving amounts, but hopefully that's just my error and I'll figure it out. I did just create a package insight that matches my RE report and query exactly so I know I'm on the right track. We're going to put together 2 fantastic dashboards before showing it to everyone in our department. I'm a fan of this product!2
-
Is anyone else having trouble with the screen freezing? I have a dashboard filter for "Fundraiser" so I can make dashboards to reflect the work each gift officer is doing. When I check the box that says "Only show selected items", the screen freezes and never comes back to life. This happens on any computer, in different browsers.0
-
Ahh, I just started my free trial and it looks like there are some fields you can't use in the same report. For example, I want to make a list of all of the Opportunity Expected Amounts for constituents in a specific Fundraiser's portfolio. If I choose one of these fields, the other field disappears from the menu. I'm guessing that that is why the screen freezes when I try to apply the filter.0
-
Yes, in fact, everything disappeared from reporting...a blank screen.0
-
We were in the EAP program but now are just in the basic reporting with standard insights. I haven't started the 90 day trial as I want to see how many things I can do with the standard insights. Here's a screencast I put together to get folks at our organization who are used to the standard gift detail and summary report comfortable with the new report builder (best watched in full screen):
6 -
Awesome Graham, thanks so much for sharing this! Excited to get access to this. Do you feel, overall, that it enables you to report most of the things you need? How did you find custom insights when you had access to it?
Now off to read your other PowerBI post!0 -
Hey Guys,
This is great, both the idea to create an insight bank that all of us can work on to help each other not only with specific reports to build but perhaps generate other ideas to share. And I really appreciate Graham's walk through of the report he created. I've been struggling a bit with this myself but that's probably because I've jumped right in to try to create my own custom insights before working more with the report builder to better understand how the different pieces work together.
The one thing I am having trouble with, and I don't think there's a solution to it at the moment, is reporting on pledge installments that are due within a particular time period. In Graham's example, what I'm assuming he's seeing (and he's got all the data that backs this up) is any pledges that were made to those two funds within that time period. So the committed includes cash and all the pledges with no double counting, then it's broken down by cash and the pledges below. What I'd like to be able to do is show cash in and what pledge installments are due within a particular time period no matter when the pledge is made. More of a cash flow type of report to determine what we expect to have within a particular time period. There's a huge dashboard I create every month for our multi-year campaign that shows cash for the entire campaign to date, pledge payments for the entire campaign to date, and pledges due for the current fiscal year. Of course now that I'm writing that I'm trying to figure out why we want to look at it this way. I don't expect to ever be able to recreate the entire report with one NXT dashboard but I would like to have the numbers match for each section so there aren't any (or as few as possible) questions about the differences. I don't think pledge installments are part of this yet but I have made the suggestion on the idea board.
This is probably a case where we're going to have to start training our staff to understand that things are not exactly the same as they are in the database view (such as soft credits that Graham mentioned). There will probably be lots of these types of things but hopefully it's just an instance of getting comfortable with reports that are much more visual and user friendly but information is reported slightly differently. I'm trying to get my staff to understand that so they start to work more in NXT and less in the database. An example like this is just what I need to do that.
Thanks again.1 -
Lori Robbins:
Just taking my first deep dive into the NXT Analysis Report Builder today. Having used Excel and Tableau for analysis for the last few years, I am struggling with this module and so far, it seems like it has many limitations around the pieces of data you can look at (much like Reports in "classic" RE). Is there a feedback or working group for early adopters or people on the 90 day trial?
Thanks,
Lori Robbins
Institute for Advanced Study
Princeton, New Jersey
I agree Lori. Definitely does not have the flexibility I was expecting from my own work with Excel, Power BI and Tableau.
0 -
Are there tutorials yet for this new feature? Graham's screen cast was excellent, but it has me wanting more training to see what this Report Builder can do. Also, wondering if anyone can explain what is available in the Insights subscription that can not be done with the basic report builder. TIA1
-
For a quick overview of Insight Designer and how to use the feature for custom analysis, you may want to check out this Quick Start resource. It also provides links to recipes for ideas of some possible giving insights and information about insights provided out-of-the-box for Dashboard builder. Thanks!3
-
Has anyone found a way to show just the top 10 of something? I know on the canned NXT dashboards it shows top 10 donors, or top 10 funds, etc. depending on the dashboard. I'd love to have one on showing the top 10 funds to our capital campaign but I don't see a way to just have an insight include anything like that. Thanks.1
-
That's a great suggestion, Matthew! You're right, we have the Top funds insight on a campaign's record, but something like that available for custom dashboards would be a nice win. Thanks for sharing the idea!0
-
Hi everyone -
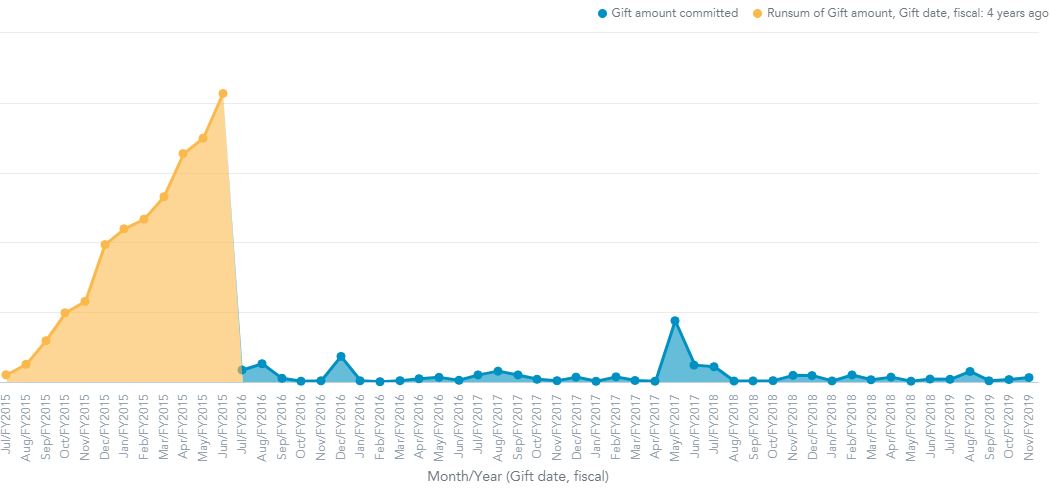
I have a report that I created in Excel to track and compare cumulative FYTD fundraising progress by fiscal year - like the overview tab in the NXT Fundraising>Reporting module, but YTD for each month instead of MTD. Like this:
In the Insight module I have gotten to this point. It's just stringing the months along without dividing them into separate fiscal years:
Can someone tell me if it's possible to do a chart like this in Insight, and if so, what am I missing?
THANKS,
Lori
1 -
Hey Lori! That's not something you can currently do with Insight Designer, but it sounds like a great idea. I'd recommend posting it to the Idea Bank. Thanks!0
-
Two things that I haven't been able to build, and so far support calls tell me can't be built in a custom insight but seem like pretty standard fundraising data points:
* A table of donors by giving level (any giving levels would do, they can be pre-set, although of course it would be awesome if we could access our donor giving tables from the classic view)
* A way to have the number of LYBUNTS on a report, rather than just current donors or constituents. I realize this is available on the Retention dashboard, but I am trying to build a dashboard specifically for our major gifts team, and this would be very helpful.
I'll put these over in the idea bank as well.
Thanks!
0 -
I have an insight which looks at solicitor credit by solicitor. It was easy enough to build and looks nice, but it does not have an 'expandable' component. We are unable to click on the bar of a particular solicitor and get a list of those gifts (like you are able to get with Actions by Solicitor), for example.
Is this something I'm doing wrong, or is this a limitation of the report builder ?
Thank you for any suggestions/comments!
0 -
Larry Wheeler:
I have an insight which looks at solicitor credit by solicitor. It was easy enough to build and looks nice, but it does not have an 'expandable' component. We are unable to click on the bar of a particular solicitor and get a list of those gifts (like you are able to get with Actions by Solicitor), for example.
Is this something I'm doing wrong, or is this a limitation of the report builder ?
Thank you for any suggestions/comments!
For other's reference, my work around was to stack runsum gift by fundraiser with the runsum credit by fundraiser.
0 -
I was able to add the number of gifts the solicitor has this year (in addition to the sum) and we can click through in the number to get to the list. I don’t know why it isn’t also available from the sum, but this was a very easy work-around for us. Hope this helps!0


Categories
- All Categories
- Shannon parent
- shannon 2
- shannon 1
- 21 Advocacy DC Users Group
- 14 BBCRM PAG Discussions
- 89 High Education Program Advisory Group (HE PAG)
- 28 Luminate CRM DC Users Group
- 8 DC Luminate CRM Users Group
- Luminate PAG
- 5.9K Blackbaud Altru®
- 58 Blackbaud Award Management™ and Blackbaud Stewardship Management™
- 409 bbcon®
- 2.1K Blackbaud CRM™ and Blackbaud Internet Solutions™
- donorCentrics®
- 1.1K Blackbaud eTapestry®
- 2.8K Blackbaud Financial Edge NXT®
- 1.1K Blackbaud Grantmaking™
- 527 Education Management Solutions for Higher Education
- 1 JustGiving® from Blackbaud®
- 4.6K Education Management Solutions for K-12 Schools
- Blackbaud Luminate Online & Blackbaud TeamRaiser
- 16.4K Blackbaud Raiser's Edge NXT®
- 4.1K SKY Developer
- 547 ResearchPoint™
- 151 Blackbaud Tuition Management™
- 1 YourCause® from Blackbaud®
- 61 everydayhero
- 3 Campaign Ideas
- 58 General Discussion
- 115 Blackbaud ID
- 87 K-12 Blackbaud ID
- 6 Admin Console
- 949 Organizational Best Practices
- 353 The Tap (Just for Fun)
- 235 Blackbaud Community Feedback Forum
- 55 Admissions Event Management EAP
- 18 MobilePay Terminal + BBID Canada EAP
- 36 EAP for New Email Campaigns Experience in Blackbaud Luminate Online®
- 109 EAP for 360 Student Profile in Blackbaud Student Information System
- 41 EAP for Assessment Builder in Blackbaud Learning Management System™
- 9 Technical Preview for SKY API for Blackbaud CRM™ and Blackbaud Altru®
- 55 Community Advisory Group
- 46 Blackbaud Community Ideas
- 26 Blackbaud Community Challenges
- 7 Security Testing Forum
- 1.1K ARCHIVED FORUMS | Inactive and/or Completed EAPs
- 3 Blackbaud Staff Discussions
- 7.7K ARCHIVED FORUM CATEGORY [ID 304]
- 1 Blackbaud Partners Discussions
- 1 Blackbaud Giving Search™
- 35 EAP Student Assignment Details and Assignment Center
- 39 EAP Core - Roles and Tasks
- 59 Blackbaud Community All-Stars Discussions
- 20 Blackbaud Raiser's Edge NXT® Online Giving EAP
- Diocesan Blackbaud Raiser’s Edge NXT® User’s Group
- 2 Blackbaud Consultant’s Community
- 43 End of Term Grade Entry EAP
- 92 EAP for Query in Blackbaud Raiser's Edge NXT®
- 38 Standard Reports for Blackbaud Raiser's Edge NXT® EAP
- 12 Payments Assistant for Blackbaud Financial Edge NXT® EAP
- 6 Ask an All Star (Austen Brown)
- 8 Ask an All-Star Alex Wong (Blackbaud Raiser's Edge NXT®)
- 1 Ask an All-Star Alex Wong (Blackbaud Financial Edge NXT®)
- 6 Ask an All-Star (Christine Robertson)
- 21 Ask an Expert (Anthony Gallo)
- Blackbaud Francophone Group
- 22 Ask an Expert (David Springer)
- 4 Raiser's Edge NXT PowerUp Challenge #1 (Query)
- 6 Ask an All-Star Sunshine Reinken Watson and Carlene Johnson
- 4 Raiser's Edge NXT PowerUp Challenge: Events
- 14 Ask an All-Star (Elizabeth Johnson)
- 7 Ask an Expert (Stephen Churchill)
- 2025 ARCHIVED FORUM POSTS
- 322 ARCHIVED | Financial Edge® Tips and Tricks
- 164 ARCHIVED | Raiser's Edge® Blog
- 300 ARCHIVED | Raiser's Edge® Blog
- 441 ARCHIVED | Blackbaud Altru® Tips and Tricks
- 66 ARCHIVED | Blackbaud NetCommunity™ Blog
- 211 ARCHIVED | Blackbaud Target Analytics® Tips and Tricks
- 47 Blackbaud CRM Higher Ed Product Advisory Group (HE PAG)
- Luminate CRM DC Users Group
- 225 ARCHIVED | Blackbaud eTapestry® Tips and Tricks
- 1 Blackbaud eTapestry® Know How Blog
- 19 Blackbaud CRM Product Advisory Group (BBCRM PAG)
- 1 Blackbaud K-12 Education Solutions™ Blog
- 280 ARCHIVED | Mixed Community Announcements
- 3 ARCHIVED | Blackbaud Corporations™ & Blackbaud Foundations™ Hosting Status
- 1 npEngage
- 24 ARCHIVED | K-12 Announcements
- 15 ARCHIVED | FIMS Host*Net Hosting Status
- 23 ARCHIVED | Blackbaud Outcomes & Online Applications (IGAM) Hosting Status
- 22 ARCHIVED | Blackbaud DonorCentral Hosting Status
- 14 ARCHIVED | Blackbaud Grantmaking™ UK Hosting Status
- 117 ARCHIVED | Blackbaud CRM™ and Blackbaud Internet Solutions™ Announcements
- 50 Blackbaud NetCommunity™ Blog
- 169 ARCHIVED | Blackbaud Grantmaking™ Tips and Tricks
- Advocacy DC Users Group
- 718 Community News
- Blackbaud Altru® Hosting Status
- 104 ARCHIVED | Member Spotlight
- 145 ARCHIVED | Hosting Blog
- 149 JustGiving® from Blackbaud® Blog
- 97 ARCHIVED | bbcon® Blogs
- 19 ARCHIVED | Blackbaud Luminate CRM™ Announcements
- 161 Luminate Advocacy News
- 187 Organizational Best Practices Blog
- 67 everydayhero Blog
- 52 Blackbaud SKY® Reporting Announcements
- 17 ARCHIVED | Blackbaud SKY® Reporting for K-12 Announcements
- 3 Luminate Online Product Advisory Group (LO PAG)
- 81 ARCHIVED | JustGiving® from Blackbaud® Tips and Tricks
- 1 ARCHIVED | K-12 Conference Blog
- Blackbaud Church Management™ Announcements
- ARCHIVED | Blackbaud Award Management™ and Blackbaud Stewardship Management™ Announcements
- 1 Blackbaud Peer-to-Peer Fundraising™, Powered by JustGiving® Blogs
- 39 Tips, Tricks, and Timesavers!
- 56 Blackbaud Church Management™ Resources
- 154 Blackbaud Church Management™ Announcements
- 1 ARCHIVED | Blackbaud Church Management™ Tips and Tricks
- 11 ARCHIVED | Blackbaud Higher Education Solutions™ Announcements
- 7 ARCHIVED | Blackbaud Guided Fundraising™ Blog
- 2 Blackbaud Fundraiser Performance Management™ Blog
- 9 Foundations Events and Content
- 14 ARCHIVED | Blog Posts
- 2 ARCHIVED | Blackbaud FIMS™ Announcement and Tips
- 59 Blackbaud Partner Announcements
- 10 ARCHIVED | Blackbaud Impact Edge™ EAP Blogs
- 1 Community Help Blogs
- Diocesan Blackbaud Raiser’s Edge NXT® Users' Group
- Blackbaud Consultant’s Community
- Blackbaud Francophone Group
- 1 BLOG ARCHIVE CATEGORY
- Blackbaud Community™ Discussions
- 8.3K Blackbaud Luminate Online® & Blackbaud TeamRaiser® Discussions
- 5.7K Jobs Board