Reporting with Insight Designer - HeatMaps?
Options
Hi...
We're loving the idea of building interactive reports with the Insight Designer, and we've already build a few pretty helpful dashboard/pages.... But the one insight element we can't seem to get working is the HeatMap. I'm guessing it's fairly new, but it's essentially a pivot table builder with cool color coding. It's exactly the sort of thing we need here, but I can't get it to work.
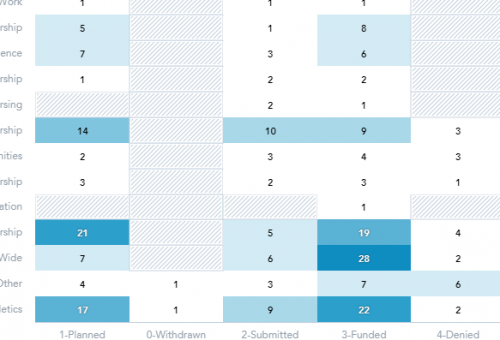
When I build a HeatMap insight in the Builder, it looks great! This looks amazing:

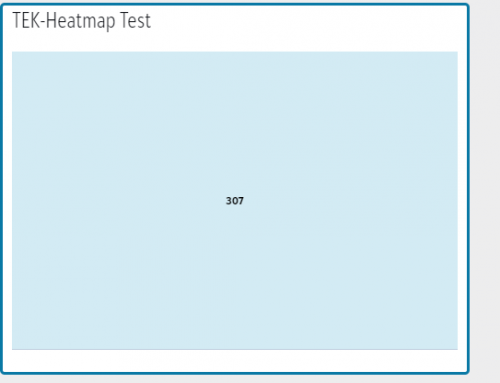
But when I save it and view it in the Dashboard it looks like this:

Has anyone else gotten one of these Heatmaps to work? They look amazing in the builder ?!!
.
We're loving the idea of building interactive reports with the Insight Designer, and we've already build a few pretty helpful dashboard/pages.... But the one insight element we can't seem to get working is the HeatMap. I'm guessing it's fairly new, but it's essentially a pivot table builder with cool color coding. It's exactly the sort of thing we need here, but I can't get it to work.
When I build a HeatMap insight in the Builder, it looks great! This looks amazing:

But when I save it and view it in the Dashboard it looks like this:

Has anyone else gotten one of these Heatmaps to work? They look amazing in the builder ?!!
.
Tagged:
2
Comments
-
Just a quick update: Support has fixed the issue with HeatMaps.... They totally rock! They're essentially color coded pivot tables that allow you show a lot of data in a very small area. We'll be using them A LOT on our reports!2
Categories
- All Categories
- Shannon parent
- shannon 2
- shannon 1
- 21 Advocacy DC Users Group
- 14 BBCRM PAG Discussions
- 89 High Education Program Advisory Group (HE PAG)
- 28 Luminate CRM DC Users Group
- 8 DC Luminate CRM Users Group
- Luminate PAG
- 5.9K Blackbaud Altru®
- 58 Blackbaud Award Management™ and Blackbaud Stewardship Management™
- 409 bbcon®
- 2.1K Blackbaud CRM™ and Blackbaud Internet Solutions™
- donorCentrics®
- 1.1K Blackbaud eTapestry®
- 2.8K Blackbaud Financial Edge NXT®
- 1.1K Blackbaud Grantmaking™
- 527 Education Management Solutions for Higher Education
- 1 JustGiving® from Blackbaud®
- 4.6K Education Management Solutions for K-12 Schools
- Blackbaud Luminate Online & Blackbaud TeamRaiser
- 16.4K Blackbaud Raiser's Edge NXT®
- 4.1K SKY Developer
- 547 ResearchPoint™
- 151 Blackbaud Tuition Management™
- 1 YourCause® from Blackbaud®
- 61 everydayhero
- 3 Campaign Ideas
- 58 General Discussion
- 115 Blackbaud ID
- 87 K-12 Blackbaud ID
- 6 Admin Console
- 949 Organizational Best Practices
- 353 The Tap (Just for Fun)
- 235 Blackbaud Community Feedback Forum
- 55 Admissions Event Management EAP
- 18 MobilePay Terminal + BBID Canada EAP
- 36 EAP for New Email Campaigns Experience in Blackbaud Luminate Online®
- 109 EAP for 360 Student Profile in Blackbaud Student Information System
- 41 EAP for Assessment Builder in Blackbaud Learning Management System™
- 9 Technical Preview for SKY API for Blackbaud CRM™ and Blackbaud Altru®
- 55 Community Advisory Group
- 46 Blackbaud Community Ideas
- 26 Blackbaud Community Challenges
- 7 Security Testing Forum
- 1.1K ARCHIVED FORUMS | Inactive and/or Completed EAPs
- 3 Blackbaud Staff Discussions
- 7.7K ARCHIVED FORUM CATEGORY [ID 304]
- 1 Blackbaud Partners Discussions
- 1 Blackbaud Giving Search™
- 35 EAP Student Assignment Details and Assignment Center
- 39 EAP Core - Roles and Tasks
- 59 Blackbaud Community All-Stars Discussions
- 20 Blackbaud Raiser's Edge NXT® Online Giving EAP
- Diocesan Blackbaud Raiser’s Edge NXT® User’s Group
- 2 Blackbaud Consultant’s Community
- 43 End of Term Grade Entry EAP
- 92 EAP for Query in Blackbaud Raiser's Edge NXT®
- 38 Standard Reports for Blackbaud Raiser's Edge NXT® EAP
- 12 Payments Assistant for Blackbaud Financial Edge NXT® EAP
- 6 Ask an All Star (Austen Brown)
- 8 Ask an All-Star Alex Wong (Blackbaud Raiser's Edge NXT®)
- 1 Ask an All-Star Alex Wong (Blackbaud Financial Edge NXT®)
- 6 Ask an All-Star (Christine Robertson)
- 21 Ask an Expert (Anthony Gallo)
- Blackbaud Francophone Group
- 22 Ask an Expert (David Springer)
- 4 Raiser's Edge NXT PowerUp Challenge #1 (Query)
- 6 Ask an All-Star Sunshine Reinken Watson and Carlene Johnson
- 4 Raiser's Edge NXT PowerUp Challenge: Events
- 14 Ask an All-Star (Elizabeth Johnson)
- 7 Ask an Expert (Stephen Churchill)
- 2025 ARCHIVED FORUM POSTS
- 322 ARCHIVED | Financial Edge® Tips and Tricks
- 164 ARCHIVED | Raiser's Edge® Blog
- 300 ARCHIVED | Raiser's Edge® Blog
- 441 ARCHIVED | Blackbaud Altru® Tips and Tricks
- 66 ARCHIVED | Blackbaud NetCommunity™ Blog
- 211 ARCHIVED | Blackbaud Target Analytics® Tips and Tricks
- 47 Blackbaud CRM Higher Ed Product Advisory Group (HE PAG)
- Luminate CRM DC Users Group
- 225 ARCHIVED | Blackbaud eTapestry® Tips and Tricks
- 1 Blackbaud eTapestry® Know How Blog
- 19 Blackbaud CRM Product Advisory Group (BBCRM PAG)
- 1 Blackbaud K-12 Education Solutions™ Blog
- 280 ARCHIVED | Mixed Community Announcements
- 3 ARCHIVED | Blackbaud Corporations™ & Blackbaud Foundations™ Hosting Status
- 1 npEngage
- 24 ARCHIVED | K-12 Announcements
- 15 ARCHIVED | FIMS Host*Net Hosting Status
- 23 ARCHIVED | Blackbaud Outcomes & Online Applications (IGAM) Hosting Status
- 22 ARCHIVED | Blackbaud DonorCentral Hosting Status
- 14 ARCHIVED | Blackbaud Grantmaking™ UK Hosting Status
- 117 ARCHIVED | Blackbaud CRM™ and Blackbaud Internet Solutions™ Announcements
- 50 Blackbaud NetCommunity™ Blog
- 169 ARCHIVED | Blackbaud Grantmaking™ Tips and Tricks
- Advocacy DC Users Group
- 718 Community News
- Blackbaud Altru® Hosting Status
- 104 ARCHIVED | Member Spotlight
- 145 ARCHIVED | Hosting Blog
- 149 JustGiving® from Blackbaud® Blog
- 97 ARCHIVED | bbcon® Blogs
- 19 ARCHIVED | Blackbaud Luminate CRM™ Announcements
- 161 Luminate Advocacy News
- 187 Organizational Best Practices Blog
- 67 everydayhero Blog
- 52 Blackbaud SKY® Reporting Announcements
- 17 ARCHIVED | Blackbaud SKY® Reporting for K-12 Announcements
- 3 Luminate Online Product Advisory Group (LO PAG)
- 81 ARCHIVED | JustGiving® from Blackbaud® Tips and Tricks
- 1 ARCHIVED | K-12 Conference Blog
- Blackbaud Church Management™ Announcements
- ARCHIVED | Blackbaud Award Management™ and Blackbaud Stewardship Management™ Announcements
- 1 Blackbaud Peer-to-Peer Fundraising™, Powered by JustGiving® Blogs
- 39 Tips, Tricks, and Timesavers!
- 56 Blackbaud Church Management™ Resources
- 154 Blackbaud Church Management™ Announcements
- 1 ARCHIVED | Blackbaud Church Management™ Tips and Tricks
- 11 ARCHIVED | Blackbaud Higher Education Solutions™ Announcements
- 7 ARCHIVED | Blackbaud Guided Fundraising™ Blog
- 2 Blackbaud Fundraiser Performance Management™ Blog
- 9 Foundations Events and Content
- 14 ARCHIVED | Blog Posts
- 2 ARCHIVED | Blackbaud FIMS™ Announcement and Tips
- 59 Blackbaud Partner Announcements
- 10 ARCHIVED | Blackbaud Impact Edge™ EAP Blogs
- 1 Community Help Blogs
- Diocesan Blackbaud Raiser’s Edge NXT® Users' Group
- Blackbaud Consultant’s Community
- Blackbaud Francophone Group
- 1 BLOG ARCHIVE CATEGORY
- Blackbaud Community™ Discussions
- 8.3K Blackbaud Luminate Online® & Blackbaud TeamRaiser® Discussions
- 5.7K Jobs Board


