Weekly report of pipeline, actions, and funds by solicitor
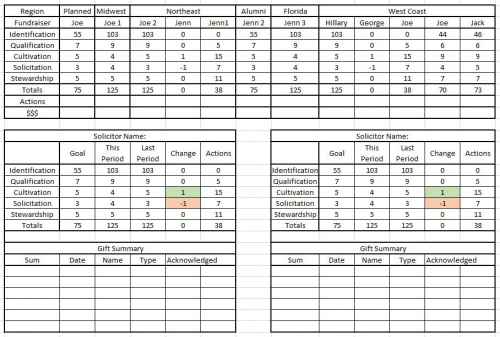
I am trying to build a weekly report that would track solicitor performance according to (1) how many constituents they have on each stage of the pipeline (through Prospect Status), (2) a tally of all the actions each solicitor had, and total of gifts per solicitor.
I still don't know how to use SAP Crystal Reports, so have to stick to what RE has to offer.
Any advice would be greatly appreciated!
Attached a sample of what I'm looking for
Comments
-
-
Brian Davies:
I create a report using pivot tables. The pivot tables are used to get the data and I copy and paste the info into a template. I can see you creating a similar process to get the data you are looking for.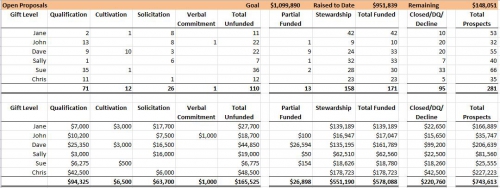
Hi Brian,
This is very helpful to see and thanks for sharing it. Would you be willing to post a snapshot of Output fields you use in your query that the pivot report is based upon?
Thank you,
Debra
0 -
Brian Davies:
I create a report using pivot tables. The pivot tables are used to get the data and I copy and paste the info into a template. I can see you creating a similar process to get the data you are looking for.
Thank you, Brian, for your response. This is really helpful. And it's very similar to the report I'm trying to create. The only difference seems to be that I also want to measure actions. I played with pivots, but as you mentioned, I couldn't configure it so that it will display the data the way I wanted. So I'll take your suggestions and just take the data from pivot and paste it in my report.
I would like to join Debra's requests for the output fields. Would be tremendously helpful
Thanks again for both of you!
Guy
0 -
Hi Guy,
As an alternative, if you are happy using excel files and downloading data from RE, there are other alternatives that can really provide easier report generation for you and possibly your organization. You should look at QlikSense Cloud, http://www.qlik.com/us/products/qlik-sense/qlik-sense-cloud, and try it out. There are a few options, and free to try out. We have been using an On Premise Install for 18 months, and our staff love it. It has really changed our reporting.
You can easily just download the raw data, and not try to format pivots and outputs in RE. You could then build dashboards like this. Then on the next sheet in the visualization you can provide Action counts, and the next sheet can contain all the details. It provides a completely different experience for your users.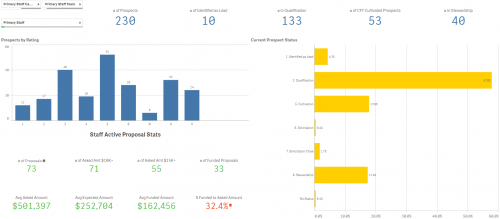
Cheers,
David1 -
Here is my query output and pivot report screenshots. I belive by carefully thinking thorugh your action types you should be able to create a pivot report to get the output you are looking for. It may take looking at multiple views or running a few different reports to get everything you need. I create my report every other week and it takes about 10 minutes.
I use this view to determine porfolio balancing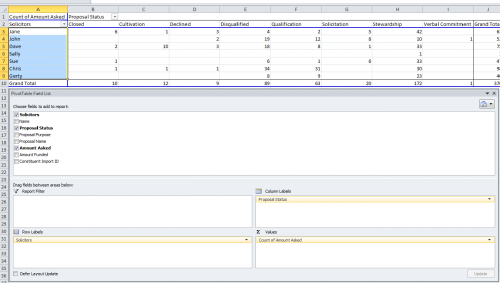
I use two versions of this pivot, first using ask amount, second using funded amount. I use ask amount to populate Qualification, Cultivation, Verbal Commitment, Decline, DQ and Closed. I use Amount Funded to polulate Partial Funded and Stewardship. We rarely use Amount Expected, we did I would pull it for Verbal Commitment. If you name your proposal stages 1. Identification, 2. Qualification, 3. Cultivation, etc. then this report would list in order.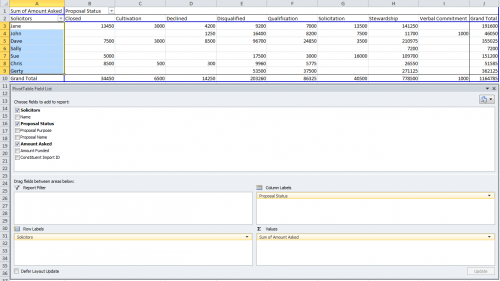
Here are my query outputs, pretty simple. Do note that if you list multiple solicitors on a proposal you will get duplicate records and may throw off your totals. At another organization we listed the primary solicitor as an attribute in which case you would pull that attribute rather than solicitors to eliminate duplicate records. The query criteria I use is Proposal type, but Prospect Proposal Is Inactive may also work depending on how you enter your proposals.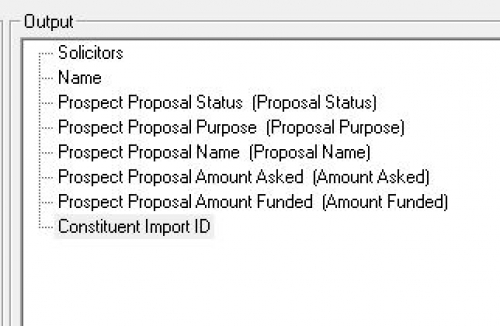
David do you have to data warehouse to use QlikSense? We are currently looking at a few options to dive deaper into our data with less hands on data manipulation, but that is for another converation...4 -
Guy Lowicz:
Thank you, Brian, for your response. This is really helpful. And it's very similar to the report I'm trying to create. The only difference seems to be that I also want to measure actions. I played with pivots, but as you mentioned, I couldn't configure it so that it will display the data the way I wanted. So I'll take your suggestions and just take the data from pivot and paste it in my report.
I would like to join Debra's requests for the output fields. Would be tremendously helpful
Thanks again for both of you!
GuyHey Guy one more thought, at another organization we put in "clearance to..." actions. This is how we tracked aging and how prospects move through our pipeline. The solicitor would put in a "Clearance to Qualify" action when the proposal was moved to Qualification then a "Clearance to Cultivate" action when the proposal went to Cultivation. In this way you can track movements per time period as well as determine how long prospects stay in each step of your pipeline.
0 -
David Ritchie:
Hi Guy,
As an alternative, if you are happy using excel files and downloading data from RE, there are other alternatives that can really provide easier report generation for you and possibly your organization. You should look at QlikSense Cloud, http://www.qlik.com/us/products/qlik-sense/qlik-sense-cloud, and try it out. There are a few options, and free to try out. We have been using an On Premise Install for 18 months, and our staff love it. It has really changed our reporting.
You can easily just download the raw data, and not try to format pivots and outputs in RE. You could then build dashboards like this. Then on the next sheet in the visualization you can provide Action counts, and the next sheet can contain all the details. It provides a completely different experience for your users.
Cheers,
DavidThis looks really great, David! Thanks so much for sharing. I'll give it a try. It's definitely more presentable than RE products.
0 -
Brian Davies:
Here is my query output and pivot report screenshots. I belive by carefully thinking thorugh your action types you should be able to create a pivot report to get the output you are looking for. It may take looking at multiple views or running a few different reports to get everything you need. I create my report every other week and it takes about 10 minutes.
David do you have to data warehouse to use QlikSense? We are currently looking at a few options to dive deaper into our data with less hands on data manipulation, but that is for another converation...Thanks, Brian! Super helpful!
0 -
Hi Brian,
We have built our own ODS. I decided it was not worth investing in a DW at this time, as QlikSense can easily do all the work that a DW does. Our ODS allows us to easily build SSRS Reports for transactional based reporting as well. It allows us to implement all our data policies as part of the ETL process. It also gives us the benefit that if those rules change, we change it one place and we are done.
QlikSense will take Excel Files, SQL Server, Oracle, etc. You can even mix data loads and Excel files together in a project. If you have a way of auto exporting an excel file out of RE, then you can drop that somewhere for Qlik to load in. We are an on-premise install of QlikSense, so I cannot speak if there are any difference in load features between the Cloud version and on premise.
Cheers,
David0
Categories
- All Categories
- Shannon parent
- shannon 2
- shannon 1
- 21 Advocacy DC Users Group
- 14 BBCRM PAG Discussions
- 89 High Education Program Advisory Group (HE PAG)
- 28 Luminate CRM DC Users Group
- 8 DC Luminate CRM Users Group
- Luminate PAG
- 5.9K Blackbaud Altru®
- 58 Blackbaud Award Management™ and Blackbaud Stewardship Management™
- 409 bbcon®
- 2.1K Blackbaud CRM™ and Blackbaud Internet Solutions™
- donorCentrics®
- 1.1K Blackbaud eTapestry®
- 2.8K Blackbaud Financial Edge NXT®
- 1.1K Blackbaud Grantmaking™
- 527 Education Management Solutions for Higher Education
- 1 JustGiving® from Blackbaud®
- 4.6K Education Management Solutions for K-12 Schools
- Blackbaud Luminate Online & Blackbaud TeamRaiser
- 16.4K Blackbaud Raiser's Edge NXT®
- 4.1K SKY Developer
- 547 ResearchPoint™
- 151 Blackbaud Tuition Management™
- 61 everydayhero
- 3 Campaign Ideas
- 58 General Discussion
- 115 Blackbaud ID
- 87 K-12 Blackbaud ID
- 6 Admin Console
- 949 Organizational Best Practices
- 353 The Tap (Just for Fun)
- 235 Blackbaud Community Feedback Forum
- 55 Admissions Event Management EAP
- 18 MobilePay Terminal + BBID Canada EAP
- 36 EAP for New Email Campaigns Experience in Blackbaud Luminate Online®
- 109 EAP for 360 Student Profile in Blackbaud Student Information System
- 41 EAP for Assessment Builder in Blackbaud Learning Management System™
- 9 Technical Preview for SKY API for Blackbaud CRM™ and Blackbaud Altru®
- 55 Community Advisory Group
- 46 Blackbaud Community Ideas
- 26 Blackbaud Community Challenges
- 7 Security Testing Forum
- 3 Blackbaud Staff Discussions
- 1 Blackbaud Partners Discussions
- 1 Blackbaud Giving Search™
- 35 EAP Student Assignment Details and Assignment Center
- 39 EAP Core - Roles and Tasks
- 59 Blackbaud Community All-Stars Discussions
- 20 Blackbaud Raiser's Edge NXT® Online Giving EAP
- Diocesan Blackbaud Raiser’s Edge NXT® User’s Group
- 2 Blackbaud Consultant’s Community
- 43 End of Term Grade Entry EAP
- 92 EAP for Query in Blackbaud Raiser's Edge NXT®
- 38 Standard Reports for Blackbaud Raiser's Edge NXT® EAP
- 12 Payments Assistant for Blackbaud Financial Edge NXT® EAP
- 6 Ask an All Star (Austen Brown)
- 8 Ask an All-Star Alex Wong (Blackbaud Raiser's Edge NXT®)
- 1 Ask an All-Star Alex Wong (Blackbaud Financial Edge NXT®)
- 6 Ask an All-Star (Christine Robertson)
- 21 Ask an Expert (Anthony Gallo)
- Blackbaud Francophone Group
- 22 Ask an Expert (David Springer)
- 4 Raiser's Edge NXT PowerUp Challenge #1 (Query)
- 6 Ask an All-Star Sunshine Reinken Watson and Carlene Johnson
- 4 Raiser's Edge NXT PowerUp Challenge: Events
- 14 Ask an All-Star (Elizabeth Johnson)
- 7 Ask an Expert (Stephen Churchill)
- 2025 ARCHIVED FORUM POSTS
- 322 ARCHIVED | Financial Edge® Tips and Tricks
- 164 ARCHIVED | Raiser's Edge® Blog
- 300 ARCHIVED | Raiser's Edge® Blog
- 441 ARCHIVED | Blackbaud Altru® Tips and Tricks
- 66 ARCHIVED | Blackbaud NetCommunity™ Blog
- 211 ARCHIVED | Blackbaud Target Analytics® Tips and Tricks
- 47 Blackbaud CRM Higher Ed Product Advisory Group (HE PAG)
- Luminate CRM DC Users Group
- 225 ARCHIVED | Blackbaud eTapestry® Tips and Tricks
- 1 Blackbaud eTapestry® Know How Blog
- 19 Blackbaud CRM Product Advisory Group (BBCRM PAG)
- 1 Blackbaud K-12 Education Solutions™ Blog
- 280 ARCHIVED | Mixed Community Announcements
- 3 ARCHIVED | Blackbaud Corporations™ & Blackbaud Foundations™ Hosting Status
- 1 npEngage
- 24 ARCHIVED | K-12 Announcements
- 15 ARCHIVED | FIMS Host*Net Hosting Status
- 23 ARCHIVED | Blackbaud Outcomes & Online Applications (IGAM) Hosting Status
- 22 ARCHIVED | Blackbaud DonorCentral Hosting Status
- 14 ARCHIVED | Blackbaud Grantmaking™ UK Hosting Status
- 117 ARCHIVED | Blackbaud CRM™ and Blackbaud Internet Solutions™ Announcements
- 50 Blackbaud NetCommunity™ Blog
- 169 ARCHIVED | Blackbaud Grantmaking™ Tips and Tricks
- Advocacy DC Users Group
- 718 Community News
- Blackbaud Altru® Hosting Status
- 104 ARCHIVED | Member Spotlight
- 145 ARCHIVED | Hosting Blog
- 149 JustGiving® from Blackbaud® Blog
- 97 ARCHIVED | bbcon® Blogs
- 19 ARCHIVED | Blackbaud Luminate CRM™ Announcements
- 161 Luminate Advocacy News
- 187 Organizational Best Practices Blog
- 67 everydayhero Blog
- 52 Blackbaud SKY® Reporting Announcements
- 17 ARCHIVED | Blackbaud SKY® Reporting for K-12 Announcements
- 3 Luminate Online Product Advisory Group (LO PAG)
- 81 ARCHIVED | JustGiving® from Blackbaud® Tips and Tricks
- 1 ARCHIVED | K-12 Conference Blog
- Blackbaud Church Management™ Announcements
- ARCHIVED | Blackbaud Award Management™ and Blackbaud Stewardship Management™ Announcements
- 1 Blackbaud Peer-to-Peer Fundraising™, Powered by JustGiving® Blogs
- 39 Tips, Tricks, and Timesavers!
- 56 Blackbaud Church Management™ Resources
- 154 Blackbaud Church Management™ Announcements
- 1 ARCHIVED | Blackbaud Church Management™ Tips and Tricks
- 11 ARCHIVED | Blackbaud Higher Education Solutions™ Announcements
- 7 ARCHIVED | Blackbaud Guided Fundraising™ Blog
- 2 Blackbaud Fundraiser Performance Management™ Blog
- 9 Foundations Events and Content
- 14 ARCHIVED | Blog Posts
- 2 ARCHIVED | Blackbaud FIMS™ Announcement and Tips
- 59 Blackbaud Partner Announcements
- 10 ARCHIVED | Blackbaud Impact Edge™ EAP Blogs
- 1 Community Help Blogs
- Diocesan Blackbaud Raiser’s Edge NXT® Users' Group
- Blackbaud Consultant’s Community
- Blackbaud Francophone Group
- 1 BLOG ARCHIVE CATEGORY
- Blackbaud Community™ Discussions
- 8.3K Blackbaud Luminate Online® & Blackbaud TeamRaiser® Discussions
- 5.7K Jobs Board


