DAX - Power BI - Donor Counts with specifics


Hi,
I have been working on Power BI to produce information about donor counts and would like to hear how are others doing this. I will post how I did it, but I want to know who else has done this and if so, how you have done it.
Let's start with simple data table:
- Table gift-by-soft, which has 3 columns: cid (constituent records id), gift_date, amount.
- table is filtered to ONLY have 2018-2023 gifts.
- Table constituent, which has 5 columns: records_id, region, chapter, first_gift_year
The tables are related by gift-by-soft(cid) MANY-TO-ONE constituent(records_id)
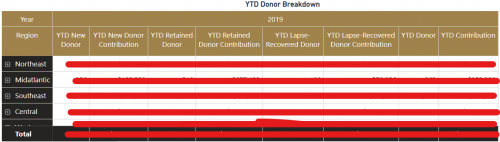
The report needed is for the following statistics per year by region/chapter. Each constituent can only belong to 1 region and 1 chapter. There are total of 6 regions, with each region having anywhere from 1 to 7 chapters. Report also to display the same statistics Year-To-Date per year by region/chapter.
Statistics to report:
- Donor Category:
- Less Than $1K donor
- $1K (inclusive) to $5K (exclude) donor
- $5K (inclusive) to $100K (exclude) donor
- $100K or More donor
- Donor Breakdown:
- New Donor
- Retained Donor
- Defined as those donated Last Year AND Donated This Year
- Lapse-Recovered Donor
- Defined as donated ANY year before Last Year AND did not donate Last Year AND Donated This Year
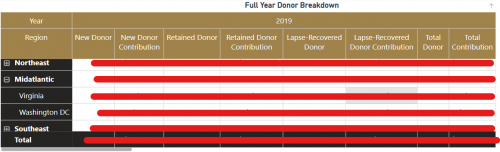
Here's what my reports looks like in a matrix visualization for Donor Breakdown, I will post how I get to this report in the following days, but would love to hear if anyone else did this and how. Thank you.
Comments
-
@Alex Wong - Do you want to cover this at user group tomorrow?
0 -
@Heather McLean
sure. but would really like to know if other does this and how too.0 -
@Alex Wong - Yes, we'd put this in a project help/ share section.
0 -
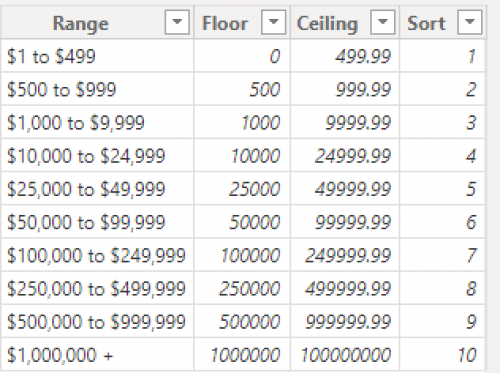
Hi Alex, in follow-up to the user group today, here is one approach for working with ranges. This does rely on calculated columns more than measures. I'm not sure of the performance implications but it works smoothly with our data. You'd have to swap in your table and field names.
Create a table of the Ranges to be analyzed. This is a disconnected table in the model with no relationship to your other tables.
Optional: create a calculated column with an aggregation in your existing table if needed (i.e. your data is at the gift level, but you want total annual gifts to correspond to the ranges. The example below aggregates by donor, by fiscal year.
Annual Giving = CALCULATE(SUM(GIFTS[Amount]),FILTER(GIFTS,GIFTS[Constituent ID]=EARLIER(GIFTS[Constituent ID])&&GIFTS[Fiscal year]=EARLIER(GIFTS[Fiscal year])))
Create a calculated column in your fact table that tags each record with the range. This is the column that would be pulled into visualizations.
Annual Giving Range = CALCULATE(VALUES(GIFTRANGE[Range]),FILTER(GIFTRANGE,GIFTS[Annual Giving]>=GIFTRANGE[Floor]&&GIFTS[Annual Giving]<=GIFTRANGE[Ceiling]))
With the ranges effectively acting as a dimension and a proper dates table, basic measures for amount, counts, etc. work well.
0 -
@Chad Margenau
Thank you for posting.From what I understand, “Annual Giving” is a column of a specific year's of total giving by a donor. Either created by Power Query or DAX as a column in the constituent table. Meaning if I want to have info on multiple years of donor category, I will need to create 1 per year: “2023 Annual Giving”, “2022 Annual Giving”, “2021 Annual Giving” etc. Is that right?
0 -
@Alex Wong
There are different ways to do this, but the simplest to test the idea would be to place that column in your gift-by-soft table. It will calculate the total giving by constituent ID by year. You don't need a separate column for each year. The columns you'd need to add are “Year" (or fiscal year), “Annual Giving”, “Annual Giving Range”.Likely, you can alternatively isolate year through DAX inside the “Annual Giving” field formula to avoid a “Year” column, but I like to add the column to create a clear trail of process.
A downside of this approach is that it will then repeat that annual giving value and your range description for every gift by constituent each year. However you wouldn't be using it in a metric, only to be able to identify the range as a dimension, and as such you may consider making it a hidden column. Your metrics would still be driven by the “amount” field.
0 -
@Chad Margenau
Ok, I think I understand your approach. and as you mention as the downside, this is making a lot of dup data in column (again if I understand you correctly).cid gift_date amount year annual_giving 1 1/6/2022 10 2022 30 1 1/8/2022 20 2022 30 1 1/9/2023 50 2023 50 the more rows you have.. the bigger the size of table.
Definitely an approach I haven't consider before, maybe nice to do when there isn't a lot of data row.
0 -
@Alex Wong
That is the approach. Then you'd use the annual giving to bring in the range description from the new table. We have pretty big data sets and complex modeling with no performance issues related to this.If you like the concept but not the duplication, you might be able to avoid some of that by creating a summary table based on your current table that would just list CID, Year, Annual Giving (one line per ID per year). The DAX SUMMARIZE function might be an option. Then you wouldn't even need the Annual Giving field, the SUMMARIZE function should do that piece. Then pull the range description form that newly created summarized table.
2 -
@Alex Wong and @Chad Margenau , I am attaching an example that calculates each donor's annual value per gift fiscal year and assigns an annual value range that can be used as a dimension. This uses Chad's suggestion for a SUMMARY table. I started with @Ellen Smith ‘s template from her post: Power BI Template for use with Exports. Please take a look at the first Page in the attached report and explore the drill-through to the gift details to validate the annual value calculation. This dimension for Annual Value Range eliminates the repetitive measure calculations. I chose to relate the summary table to Gift table by creating an ID value that concatenates ConsID + FiscalYear. Perhaps it would have worked to relate to Constituent & Calendar tables respectively, instead of creating a new key field.
@Alex Wong , might this method be useful in your case? @Chad Margenau , do you have an opinion about the relationship in the data model?
Attachment: Annual Giving Level_w_calculated_table.zip
Annual Giving = SUMMARIZE(GiftSplits
, 'Calendar'[Fiscal Year] // summarize value per fiscal year
, Gift[Gf_CnBio_ID] // summarize for each hard credit donor
// This field relates to Gift table:
, "AnnualGivingID" , CONCATENATE(Gift[Gf_CnBio_ID],'Calendar'[Fiscal Year])
// sum gift split amounts:
, "Annual Value", [Giving]
// Assign the range to report by comparing the calculated annual value to a range de-coder table:
, "Annual Value Range", CALCULATE(VALUES('Annual Value Ranges'[Annual Value Range]),FILTER('Annual Value Ranges',[Giving]>= 'Annual Value Ranges'[MinRange] && [Giving]<='Annual Value Ranges'[MaxRange]))
// Pull over the Sort Value too so that we can sort the ranges:
, "Annual Value Range Sort", CALCULATE(VALUES('Annual Value Ranges'[SortValue]),FILTER('Annual Value Ranges',[Giving]>= 'Annual Value Ranges'[MinRange] && [Giving]<='Annual Value Ranges'[MaxRange]))
)
1 -
@Rebecca Sundquist
Thank you, I will check out these summarize table you have1 -
@Rebecca Sundquist
I started looking into the file you attached. It is impressive and the summarize DAX might come in handy in the future for me. Thank you.One of the bigger issue I ran into was performance, actually more problematic is the memory use and fail to load on BI service. Looking at your file, it has 17K constituent records and about 34K gift records. For us, if we only go back to 2012, we have 162K constituent records and 688K gift records. Do you think this might be an issue?
0 -
@Alex Wong, I can't guess how the DAX will perform on the larger data set. An alternative would be to create a summary table or view in your warehouse, allowing SQL Server to do the work.
0


Categories
- All Categories
- 6 Blackbaud Community Help
- High Education Program Advisory Group (HE PAG)
- BBCRM PAG Discussions
- Luminate CRM DC Users Group
- DC Luminate CRM Users Group
- Luminate PAG
- 186 bbcon®
- 1.4K Blackbaud Altru®
- 389 Blackbaud Award Management™ and Blackbaud Stewardship Management™
- 1K Blackbaud CRM™ and Blackbaud Internet Solutions™
- 14 donorCentrics®
- 355 Blackbaud eTapestry®
- 2.4K Blackbaud Financial Edge NXT®
- 616 Blackbaud Grantmaking™
- 542 Blackbaud Education Management Solutions for Higher Education
- 33 Blackbaud Impact Edge™
- 3.1K Blackbaud Education Management Solutions for K-12 Schools
- 909 Blackbaud Luminate Online® and Blackbaud TeamRaiser®
- 207 JustGiving® from Blackbaud®
- 6.2K Blackbaud Raiser's Edge NXT®
- 3.5K SKY Developer
- 236 ResearchPoint™
- 116 Blackbaud Tuition Management™
- 375 YourCause® from Blackbaud®
- 160 Organizational Best Practices
- 232 The Tap (Just for Fun)
- 31 Blackbaud Community Challenges
- Blackbaud Consultant’s Community
- 19 PowerUp Challenges
- 3 Raiser's Edge NXT PowerUp Challenge: Gift Management
- 4 Raiser's Edge NXT PowerUp Challenge: Events
- 3 Raiser's Edge NXT PowerUp Challenge: Home Page
- 4 Raiser's Edge NXT PowerUp Challenge: Standard Reports
- 4 Raiser's Edge NXT PowerUp Challenge #1 (Query)
- 71 Blackbaud Community All-Stars Discussions
- 47 Blackbaud CRM Higher Ed Product Advisory Group (HE PAG)
- 743 Community News
- 2.8K Jobs Board
- Community Help Blogs
- 52 Blackbaud SKY® Reporting Announcements
- Blackbaud Consultant’s Community
- 19 Blackbaud CRM Product Advisory Group (BBCRM PAG)
- Blackbaud Francophone Group
- Blackbaud Community™ Discussions
- Blackbaud Francophone Group